It’s no secret that it’s almost impossible to win the lottery. But why do thousands of New Yorkers still buy tickets? Who’s benefitting from their ticket purchases and what are the real chances of striking it rich with a scratch-off?
To understand the math behind the odds, students from Lauren Shookoff’s advisory group at the Brooklyn School for Social Justice in Bushwick worked with CUP, Teaching Artist José Ojeda, MIT’s Civic Data Design Lab, and CUNY’s Brooklyn College to find out about the lottery in their neighborhood.
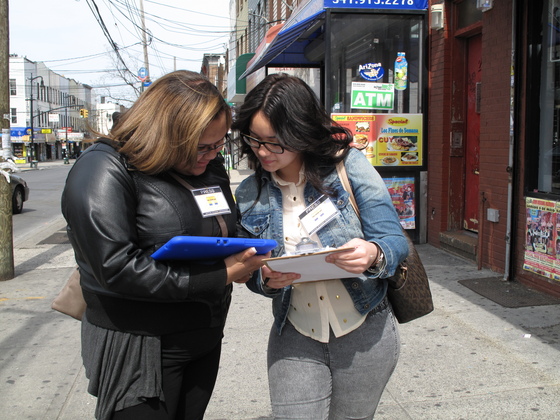
Toting tablets equipped with mapping software developed just for this project, students interviewed lotto players and retailers in their neighborhood about their playing habits, and recorded their answers with photos and audio. Back in the classroom they compared their on-the-street journalism data with an interactive map visualizing which neighborhoods are spending the most on the lotto in the whole city. They took their multimedia data, lottery ads, sketches, notes, and interviews, and created a digital tour explaining how they came to form their own opinions on the lottery.
Check out the digital maps and tours here!


